What is "data" in community development?
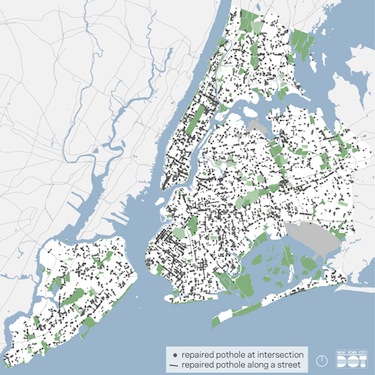
Data in community development are facts about the conditions of neighborhoods or communities and the people who live in them. Data may, for example, be rates of vacant housing, or the number of children with asthma who live in a certain neighborhood. Data aren’t always numbers. It can be stories or photos documenting community interests and needs.
When combined and given a context, data become information that can be compared, sorted, and analyzed to answer important questions about how to change programs and policies to improve both community conditions and people’s lives. For example: Have the number of children with asthma been rising? Have the rates of vacant housing been rising? Is there a connection between the two?
WHAT WE TALK ABOUT WHEN WE TALK ABOUT DATA
There are five main sources (and types) of data:
- Surveys catalogue data about people or places. They can be large (the U.S. Census) or small (a survey of voters in a ZIP code). They can be one-time or ongoing (longitudinal). The Detroit Residential Parcel Survey, for example, catalogued every residential property in the city.

- Qualitative data, collected through methods like in-depth interviews or focus groups, include the kinds of the information that are harder to capture with numbers, such as residents' perceptions of their neighborhood, or the historical and political factors shaping local conditions.
- Administrative data are collected as part of a government agency's daily operations. Useful for record keeping at federal, state, and local levels, these data – which include data on education, health, income, property transactions, and a host of other socio-economic factors — are also valuable to researchers and practitioners.
- Integrated data are data from multiple agencies or sources that are linked together, like this that links education, juvenile justice, and health and services data to identify those at high risk for absenteeism.
- Big Data are data with very high volume and variety that traditional number crunching methods can't handle. Data from traffic sensors that every 20 seconds capture cars passing at hundreds of locations around a region is an example. (The definition is up for debate.)

Data can help practitioners test their working assumptions about their efforts or programs. After all, there are times when gut instinct turns out to be wrong.
Administrators at an elementary school in South Jamaica, a low-income neighborhood in Queens, New York, assumed their students' chronic absenteeism was for the standard reasons. But the data revealed something else. It turned out that many children were absent because parents lacked the time to get to the laundromat and they didn't want to send their kids to school in dirty clothes. Simple solution: install washers and dryers at school for families to use.
Data can be used to target resources.
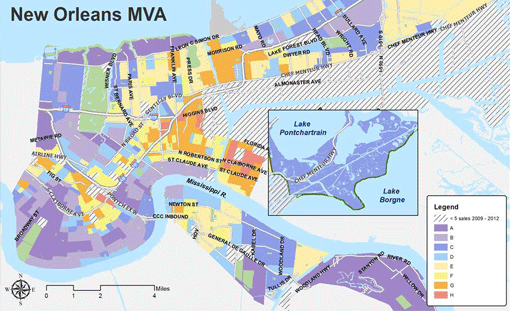
The Market Value Analysis (MVA), for example, a tool Ira Goldstein discusses in his chapter, helps planners identify which neighborhood blocks need attention. The tool identifies high rates of vacant homes or foreclosures, for example. The MVA also helps to identify unfair or illegal lending practices and broader disinvestment in neighborhoods.
"We knew that certain neighborhoods were more disinvested than others," said a member of the New Orleans Redevelopment Authority, "but we didn't really have the data to support it."

Data can bolster anecdotal evidence.
The Champlain Housing Trust in Burlington, VT, for example, works to keep housing in their city affordable. As Annie Donovan writes in her chapter, the Trust bought homes and sold them at affordable rates to qualified families, keeping an equity stake in the home, which the Trust then passed on to the next buyer. But did it work? Did homes stay affordable and did families build equity? They'd assumed so, but they weren't sure.
So, with a bit of trepidation, they tracked down the paper files of each home sale since 1980. The answer? Homes became slightly more affordable with time and 70% of sellers were able to purchase market-rate homes with no assistance. While the staff at the Housing Trust had assumed their program was working, even they were surprised by the strong findings.
Data can help make mid-course corrections.
In Minneapolis, as Cory Fleming writes, city staffers spotted an aberration in data from 311 calls and chose to redirected resources early to solve the problem. After mapping all the "nuisance" complaints staff quickly realized one district had twice the number of complaints as others. However, the district had the same number of support personnel as all other districts. As a result, they reallocated staff and resources to the higher need district. These mid-course corrections result in continuous improvement.
Data can be used to change behavior or collectively improve conditions and outcomes.
In San Diego, the predominantly Latino Old Town neighborhood had been rezoned to include light industrial among the residential neighborhood. As machine shops and car detailing shops sprung up, air quality declined, and particulates in the air increased. The particulates would stick to clothing and be carried into the homes, putting children at risk for asthma and other respiratory ailments.
As Meredith Minkler chronicles in her chapter, a research team trained local women as health workers to go door to door and measure air quality in the homes. With data in hand to show the impact, the women took their case to City Hall, and the neighborhood was eventually rezoned for residential.
As Paige Chapel writes in her chapter, that was certainly the worry in her experience when community development financial institutions when they implemented a data system that compared performance against peers. Ten years later, those fears proved unfounded. Instead, the data have introduced more standardization and transparency.
Data should point to solutions, not problems. In Jacksonville, Florida, writes J. Benjamin Warner in his chapter, community members track quality of life indicators. When trends are moving in the wrong direction, like rising crime rates, they devote resources to improving it. Areas showing improvement, on the other hand, become motivators and reminders that action can lead to change. In this way, as Patricia Bowie and Moira Inkelas describe in their chapter on the Magnolia Community Initiative in Los Angeles, data propel action.
Data inform policymaking, writes Raphael Bostic, by:
- Defining the problem.
- Identifying policies that can address the issue.
- Making predictions of how a particular policy is likely to change conditions.
- Showing what works.
- Targeting scarce dollars to those most in need or programs that are most effective.
Community members can be critical to data collection efforts. Meredith Minkler, whose work in "participatory research" spans three decades, believes it's imperative to involve residents and those most directly affected if the data are to be valid and useful. Our story on Chinatown shows why.
Other authors in this volume, including Ira Goldstein, Rick Jacobus, and Annie Donovan, call this process "ground-truthing" and argue that it should be a part of every research effort.
Involving community also helps reframe the issues not as problems, but as strengths. "Appreciative inquiry" asks residents to describe their vision for their neighborhood — what they love, why they moved there, and where they see it in the future. As the saying goes, you can't build from broken.
Data can help organizations see their shared goals and related issues. When all the relevant actors join together, commit to overarching goals, and devise shared measures to track performance against those goals, systems align.
"When stakeholders first came together to define common measures of homelessness," writes Fay Hanleybrown and colleagues in their seminal article on collective impact, "they were shocked to discover that the many agencies, providers, and funders were using thousands of separate measures relating to homelessness. …Merely developing a limited set of eight common measures with clear definitions led to improved services and increased coordination."
Rebecca London and Milbrey McLaughlin, whose chapter describes the Youth Data Archive, outline five factors that make collaboration successful:
- Time — to establish relationships trust and new routines;
- Buy-in: A shared sense of urgency that motivates action;
- An independent, neutral convener with a neutral stance on data and findings;
- An agreed on set of outcomes and data;
- A research agenda that the data can answer and findings that people can act on.
Six considerations include:
- Use data to learn about what is working, what is not, and why.
- Clearly define hoped-for changes.
- Include early, middle, and long-term outcomes to measure.
- Consider what will motivate people to focus on collective action.
- Ensure that the effort won't be too time-consuming or costly to collect or sustain.
- Consider a research agenda that is aligned, answerable, and actionable. Research should be aligned with the goals of the organization. The question should be answerable with data that community practitioners collect or can get their hands on. And the results should be actionable; the organization and its partners should be able to take action based on the results.
Examples of data sources and use:
- Community Health Needs Assessment (more in David Fleming's chapter)
- County Health Rankings (see more in Bridget Catlin chapter)
- Motor City Mapping
- Quality of Life Progress Report (Jacksonville, FL. See more in J. Benjamin Warner's chapter)
- Massachusetts Environmental Public Health tracking (see more in John Petrila's chapter)
- Data.gov (see more in Amias Gerety's chapter)
- National Mortgage Database (see more in Robert Avery's chapter)
- KidsCount (Annie E. Casey Foundation)
- Social Impact Calculator (see more in Nancy Andrew's chapter)
- Data-Smart City Solutions (Harvard)
Several chapters in the book note consultants, websites, evaluation teams, and other tools to help nonprofit organizations manage and use data, including:
- DataMade (specializes in infographics and maps on crime, housing, and other civic data)
- Efforts to Outcomes (by Social Solutions)
- FamilyMetrics
- Guidestar.org
- HomeKeeper National Data Hub
- ICMA Insights
- OpenPlans
- PerformWell (Urban Institute, Child Trends, Social Solutions)
- SuccessMeasures (NeighborWorks)